
Possible breach of resistance level by Hong Kong 50 Index
Hong Kong 50 Index is moving towards a resistance line which it has tested numerous times in the past. We have seen it retrace from this line before, so at this stage it isn’t clear whether it will breach this line or rebound as it did before. If Hong Kong 50 Index continues in its […]
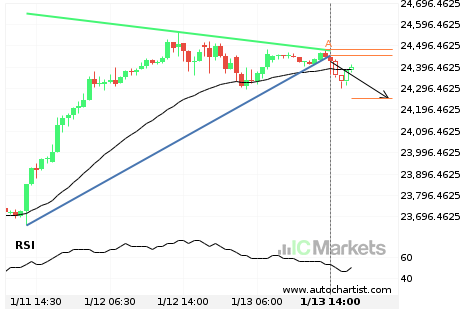
A possible start of a bearish trend on Hong Kong 50 Index
Hong Kong 50 Index has broken through a support line of a Triângulo chart pattern. If this breakout holds true, we may see the price of Hong Kong 50 Index testing 24251.4879 within the next 7 hours. But don’t be so quick to trade, it has tested this line in the past, so you should […]
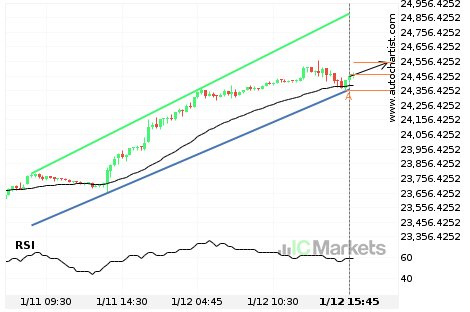
Either a rebound or a breakout imminent on Hong Kong 50 Index
Hong Kong 50 Index is heading towards the resistance line of a Canal ascendente. If this movement continues, the price of Hong Kong 50 Index could test 24551.4000 within the next 6 hours. It has tested this line numerous times in the past, so this movement could be short-lived and end up rebounding just like […]
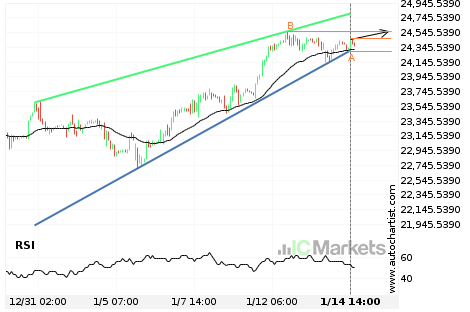
Will Hong Kong 50 Index have enough momentum to break resistance?
Hong Kong 50 Index is heading towards the resistance line of a Canal ascendente and could reach this point within the next 13 hours. It has tested this line numerous times in the past, and this time could be no different from the past, ending in a rebound instead of a breakout. If the breakout […]
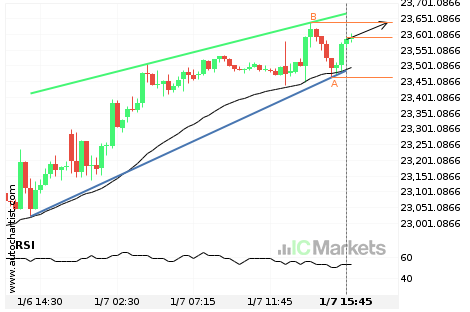
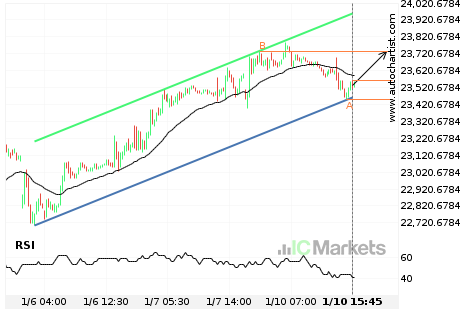
Will Hong Kong 50 Index have enough momentum to break resistance?
Hong Kong 50 Index is heading towards the resistance line of a Cunha ascendente and could reach this point within the next 5 hours. It has tested this line numerous times in the past, and this time could be no different from the past, ending in a rebound instead of a breakout. If the breakout […]

Australia 200 Index experienced an exceptionally large movement
For those of you that don’t believe in trends, this may be an opportunity to take advantage of an exceptional 1,22% move on Australia 200 Index. The movement has happened over the last 16 hours. For those trend followers among you, you may think about riding this possible trend.
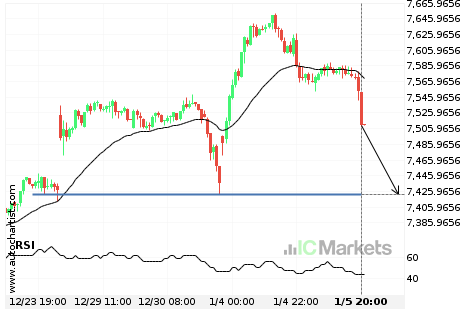
Australia 200 Index – getting close to psychological price line
Australia 200 Index is moving towards a support line. Because we have seen it retrace from this level in the past, we could see either a break through this line, or a rebound back to current levels. It has touched this line numerous times in the last 14 days and may test it again within […]
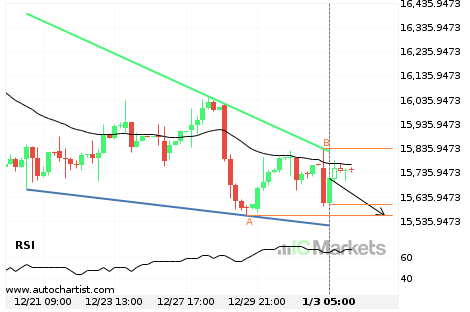
Either a rebound or a breakout imminent on FTSE China A50 Index
FTSE China A50 Index is heading towards the support line of a Cunha descendente. If this movement continues, the price of FTSE China A50 Index could test 15559.7900 within the next 3 days. It has tested this line numerous times in the past, so this movement could be short-lived and end up rebounding just like […]

FTSE China A50 Index approaching important 15826.1201 price line
FTSE China A50 Index is approaching the resistance line of a Resistência. It has touched this line numerous times in the last 10 days. If it tests this line again, it could do so in the next 2 days.
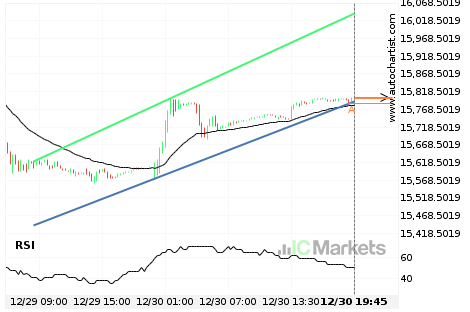
Either a rebound or a breakout imminent on FTSE China A50 Index
FTSE China A50 Index is heading towards the resistance line of a Canal ascendente. If this movement continues, the price of FTSE China A50 Index could test 15801.1700 within the next 10 hours. It has tested this line numerous times in the past, so this movement could be short-lived and end up rebounding just like […]